Hello. Zizily
All tools at one place.
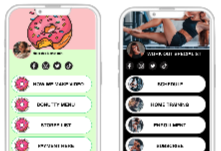
Zizi.ly lets you create short links, QR codes, link-in-bio pages, and manage bookings.

Shorten long URLs
Create QR
Reduce Document Size
Drop files here
Currently supported file types: JPG, PNG, PDF, Gif.
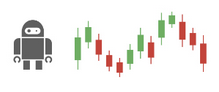
Share screenshots and screen recordings as URLs
Upload a chart screenshot. AI analyzes technical patterns
to predict if the price will go "up" or "down".
(Details)
Upload a chart screenshot to analyze
Upload a chart screenshot. AI analyzes technical patterns
to predict if the price will go "up" or "down".
(Details)
Upload a chart screenshot to analyze
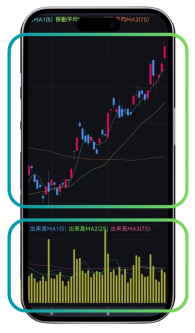
The chart you submitted for analysis. If the image does not meet the criteria, analysis may not be performed correctly.
The chart you submitted for analysis. If the image does not meet the criteria, analysis may not be performed correctly.
Match rateが高いほど分析結果の精度が上がる傾向にあります。
The chart you submitted for analysis. If the image does not meet the criteria, analysis may not be performed correctly.
Correct image criteria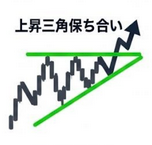
上昇三角持ち合い(アセンディング・トライアングル)は、高値が一定(抵抗線)で安値が切り上がる(支持線)強気のチャートパターンです。買い圧力が徐々に強まっていることを示し、上値抵抗線を上抜けると、上昇トレンドが再開・加速する可能性が高いサイン(買いシグナル)とされます。
The chart you submitted for analysis. If the image does not meet the criteria, analysis may not be performed correctly.
The chart you submitted for analysis. If the image does not meet the criteria, analysis may not be performed correctly.
Match rateが高いほど分析結果の精度が上がる傾向にあります。
The chart you submitted for analysis. If the image does not meet the criteria, analysis may not be performed correctly.
Correct image criteria
上昇三角持ち合い(アセンディング・トライアングル)は、高値が一定(抵抗線)で安値が切り上がる(支持線)強気のチャートパターンです。買い圧力が徐々に強まっていることを示し、上値抵抗線を上抜けると、上昇トレンドが再開・加速する可能性が高いサイン(買いシグナル)とされます。


AI × Analytics
Just upload a screenshot of a stock or FX chart.
AI analyzes hundreds of patterns and big data
and submits the probability of going "up" or "down".